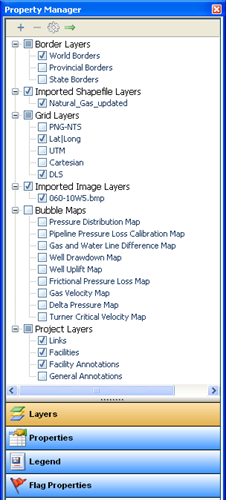
Layers
The Property Manager pane, Layers, manages the following layer types:
- Border Layers – toggles on and off the display of world, provincial, and state borders
- Imported Shapefile Layers – toggles on and off imported shapefiles
- Grid Layers – toggles on and off the display of coordinate system grid layers
- Imported Image Layers – toggles on and off imported image files
- Bubble Maps – toggles on and off the display of bubble map and link map layers
- Project Layers – toggles on and off the display of links, facilities, and annotations
- Flag Layers - toggle on and off the display of flags
Layer functionality
By default, layers are grouped by type in the order displayed above. The display order of the layers determines the drawing order for what is visible on the map. Each layer draws over the previous layer, potentially obscuring the previous layer's information on the map. For example, if you choose to place your Project Layers first, links, facilities, and annotations may no longer be visible if the border layers are toggled on.
You can group layers by type, or by a flat list. Each layer can be moved to a new position within its group type or within a flat list in the layer tree. Each group can also be moved to a new group location in the tree; it cannot be moved to within another layer group. The layer order remains in place when you restart the application.
Layers can be added or removed with the exception of layers in the border, grid, and project layer groups. These are default layers and are always included.
Border layers
Border layers display the world map including provincial borders and states for North America. These are default layers that cannot be deleted.
Imported shapefile layers
The following shapefile layer options are available:
- Shapefile Info - view details about the shapefile, such as, the number and type of shape, label selection, and the bounding box
- DBF Info - database files (DBF) that contain attribute information that can be imported when the shapefile is converted to facilities or links
- Goto Shapefile Area - zooms the map to the area where the shapefile is loaded
- Customize Drawing Tools - change the line color, line thickness, fill color, and other visual attributes of the shape. This option is also available for the default border shapefiles
- Highlight Shape(s) - highlight the selected shape
- Show Labels - show the label title for the shape
Only shapefiles with Mercator projections, and locations in geographical coordinates (i.e., latitude and longitude), can be imported.
The following DBF data is available for import when a shapefile is converted to facilities or links.
Facility attribute DBF data
If the shapefile is converted to facilities, the following data can be imported:
| DBF Item | Piper Editor Location | Comments |
|---|---|---|
| Name | Facility Editor | Includes a numbering system for unique naming |
| Surface Location | GIS Position Editor | Can be lat / long, UTM, DLS, NTS, and / or an elevation |
| Sandface location | GIS Position Editor | Can be lat / long, UTM, DLS, NTS, and / or an elevation |
| Remarks | Facility Editor |
Link attribute DBF data
If the shapefile is converted to links,. the following data can be imported:
| DBF Item | Piper Editor Location | Comments |
|---|---|---|
| Name | Gathering System Editor | Includes a numbering system for unique naming |
| Pipe Length | Gathering System Editor | Scaled for individual links based on proportional map distance |
| Internal Diameter | Gathering System Editor | |
| External Diameter | Gathering System Editor | Used with wall thickness to calculate inner diameter |
| Wall Thickness | Gathering System Editor | Used with external diameter to calculate inner diameter |
| Roughness | Gathering System Editor | |
| Remarks | Gathering System Editor |
For technical information on shapefiles, see ESRI Shapefile Technical Description (a new window opens).
Compatibility
If you encounter issues importing a shapefile, it may be because your shapefile is incompatible with Piper. Ensure that your shapefile meets the following requirements:
- Mercator projection
- Geographic coordinate system (GCS)
- NAD 27 (North American Datum, created in 1927), or NAD 83 (North American Datum, modified in 1983), or WGS 84 (World Geodetic System, modified in 1984)
- Latitude and Longitude in decimal degrees
Grid layers
These layers identify locations on the earth's surface through the following grid selections: PNG-NTS, Lat/Long, UTM, and DLS. Relative locations are provided using the Cartesian grid.
Imported image layers
Imported images, used to provide additional visual references, such as contour lines for elevation, are included in this group.
Bubble map layers
Bubble map layers are diagnostic tools that display the operational conditions of the model.
By default, the following bubble maps are available:
- Pressure distribution - displays operating pressures throughout the model
- Pipeline pressure loss calibration - the difference between measured pipeline pressures (measured gas line pressure values in the well options) and calculated pressures at each of the wells
- Gas and water line difference - displays the difference between the calculated line pressure loss and the measured water line pressure (entered in the Well Options menu)
- Well drawdown - displays the wellhead drawdown for wells that have been defined using a deliverability model (wellhead, sandface, or reservoir model)
- Well uplift - displays the ultimate uplift potential for wells that have been defined using a deliverability model (wellhead, sandface, or reservoir model)
By default, the following link maps are available:
- Frictional pressure loss - identifies pipelines with limited capacity
- Gas velocity- displays the average gas velocity in each segment of the pipeline
- Delta pressure - displays the total line pressure loss in each segment of the pipeline
- Turner critical velocity - displays whether the current velocity in the pipeline segment is above or below the Turner critical velocity
Additional options provided for bubble maps include:
- Options - to redefine bubble map preferences and the entities the bubble map is applied to
- Auto Range - to calculate a range based on the data for the entities used in the bubble map
- Legend - to redefine the size, position, transparency, and visibility of the legend
Project layers
This layer includes links, facilities, facility annotations, and general annotations. The facilities layer provides an additional menu option (Displaying All) to toggle viewing on and off for facility types.
Flag layers
With flags, you can highlight specific facilities and wells to mark areas of interest on the map. Once a flag is created, it is added to the Property Manager as a flag layer.
After an initial flag layer is created, the flag layer options are expanded to include:
- Add Flag Layer - adds a flag to Flag Layers, Flag Properties, and to selected facilities on the GIS map
- Flag Properties - changes the flag properties associated with a flag layer
- Remove Flag Layer - removes the flag from the Flag Layers, Flag Properties, and the GIS map